 项目中图表相关实践
# qiun-charts相关
# 注意点
# 滚动的要设置
ontouch:是否监听@touchstart@touchmove@touchend事件;
onzoom:是否开启图表双指缩放功能,仅针对直角坐标系图表,并且开启了ontouch及opts.enableScroll滚动条才可用;
enableScroll:开启滚动条,X轴配置里需要配置itemCount单屏幕数据点数量;
canvas2d:canvas2d模式,用于解决小程序层级过高及拖拽卡顿问题;
canvasId:开启canvas2d模式,必须指定canvasId,否则会出现偶尔获取不到dom节点的问题; 开启onmovetip后,同时开启canvas2d模式(需要传canvasId),否则在小程序端会很卡。
type="mix" :ontouch="true"
enableScroll: false,
xAxis: {
    itemCount: 5,
    disableGrid: true,
    //labelCount:6,
    rotateLabel: true,
    rotateAngle: 20,
    fontSize: 10,
    marginTop:5,
},
1
2
3
4
5
6
7
8
9
10
11
2
3
4
5
6
7
8
9
10
11
:canvasId="canvasId"动态设置
"canvasId": new Date().getTime(),
onLoad() {
	this.canvasId = this.randomString();
}

methods: {
// 生成32位随机字符串
randomString() {
	let len = 32;
	let chars = 'ABCDEFGHIJKLMNOPQRSTUVWXYZabcdefghijklmnopqrstuvwxyz';
	let maxPos = chars.length;
	let result = '';
	for (let i = 0; i < len; i++) {
		result += chars.charAt(Math.floor(Math.random() * maxPos));
	}
	return result;
}
1
2
3
4
5
6
7
8
9
10
11
12
13
14
15
16
17
2
3
4
5
6
7
8
9
10
11
12
13
14
15
16
17
qiun-data-charts层级过高的解决办法
原因:因canvas在微信小程序是原生组件,如果使用自定义tabbar或者自定义导航栏,图表则会超出预期,此时需要给组件的canvas2d传值true来使用type='2d’的功能,开启此模式后,一定要在组件上自定义canvasId,不能为数字,不能动态绑定,要为随机字符串!不能“真机调试”,不能“真机调试”,不能“真机调试”开发者工具显示不正常,图表层级会变高,而正常预览或者发布上线则是正常状态,开发者不必担心,一切以真机预览为准(因微信开发者工具显示不正确,canvas2d这种模式下给调试带来了困难,开发时,可以先用:canvas2d="false"来调试,预览无误后再改成true)
<qiun-data-charts :canvas2d='true' :ontouch="true" :opts="options" type="line" :chartData="chartData" />
1
# 优化后的常用配置【推荐】
	chartData: {},
    chartOpt: {
        color: ["#1890FF","#2FC25B","#FAC858","#EE6666","#73C0DE","#3CA272","#FC8452","#9A60B4","#ea7ccc"],
        padding: [15,5,0,5],
        dataLabel: false,
        dataPointShape: false,
        xAxis: {
            // itemCount: 5,
            labelCount:6,
            rotateLabel: true,
            rotateAngle: 20,
            fontSize: 10,
            marginTop:5,

        },
        yAxis: {
            // showTitle: true,
            data: [{
                position: "left",
                titleOffsetY: -20,
            },{
                position: "right",
            },]
        },
        extra: {
            line: {
                type: "curve",
                width: 2,
                activeType: "hollow",
                linearType: "custom",
                onShadow: true,
                animation: "horizontal"
            }
        }
    },

    if (res.code === 0) {
        const xData = []
        const osmoticList = []
        const tempList = []
        const fmList = []
        if (res.data && res.data.length > 0) {
            res.data.forEach((item) => {
                xData.push(item.tm.slice(5))
                osmoticList.push(item.osmotic)
                tempList.push(item.temp)
                fmList.push(item.fm)
            })
        }
        this.$nextTick(() => {
            let chart = {
                categories: xData,
                series: [{
                    name: "渗压(m)",
                    data: osmoticList,
                },
                {
                    name: "温度(℃)",
                    data: tempList,
                },
                {
                    index: 1,
                    name: "频模",
                    data: fmList,
                },]
            }
           this.chartData = JSON.parse(JSON.stringify(chart))
       })
    }
1
2
3
4
5
6
7
8
9
10
11
12
13
14
15
16
17
18
19
20
21
22
23
24
25
26
27
28
29
30
31
32
33
34
35
36
37
38
39
40
41
42
43
44
45
46
47
48
49
50
51
52
53
54
55
56
57
58
59
60
61
62
63
64
65
66
67
68
69
2
3
4
5
6
7
8
9
10
11
12
13
14
15
16
17
18
19
20
21
22
23
24
25
26
27
28
29
30
31
32
33
34
35
36
37
38
39
40
41
42
43
44
45
46
47
48
49
50
51
52
53
54
55
56
57
58
59
60
61
62
63
64
65
66
67
68
69
# 兼容echart参数【h5端】
# :echartsH5="true"
<view class="pb-2">
    <view v-if="sllOpts.xAxis[0].data.length" class="mt-1 chart-box2">
<!-- 					<qiun-data-charts
            type="line"
            :opts="sllOpts"
            :chartData="sllChartData"
            canvasId="sllCanvas2d"
            :canvas2d="true"
            :ontouch="true"
            :onmovetip="true"
            tooltipFormat="tooltipTempTime"
        /> -->
        <qiun-data-charts
            type="line"
            :echartsH5="true"
            :eopts="sllOpts"
            :chartData="sllChartData"
        />
    </view>
    <view v-else  class="chart-box2 mt-1 d-flex flex-column j-center a-center font-34">
        <!-- <uni-icons type="spinner-cycle" size="70"></uni-icons> -->
        <image  src="@/static/image/common/empty_chart.png" mode="widthFix" style="width:120rpx"/>
        <view class="hint-text">
            暂无渗流量数据
        </view>
    </view>
    <view class="mt-2 d-flex">
        <view class="flex-1 p-1 d-flex a-center data-item fw-bold text-center">
            <span class="flex-1">{{slInfo.now}} L/s</span>
            <span class="flex-1 color3">当前渗流</span>
        </view>
        <view class="ml-3 flex-1 p-1 d-flex a-center data-item fw-bold text-center">
            <span class="flex-1">{{slInfo.maxQ}} L/s</span>
            <span class="flex-1 color4">最大滲流</span>
        </view>
    </view>
</view>
1
2
3
4
5
6
7
8
9
10
11
12
13
14
15
16
17
18
19
20
21
22
23
24
25
26
27
28
29
30
31
32
33
34
35
36
37
2
3
4
5
6
7
8
9
10
11
12
13
14
15
16
17
18
19
20
21
22
23
24
25
26
27
28
29
30
31
32
33
34
35
36
37
参数
// 近7天渗流量
sllChartData: {},
sllOpts: { // 这里用的是echarts的配置
    tooltip: {
        trigger: 'axis',
        axisPointer: {
            type: 'cross',
            label: {
                backgroundColor: '#6a7985',
            },
        }
    },
    legend:{
        show: false
    },
    color: ["#14A4FC","#fc662a",  "#D3D3D3"],
    grid: {
        left: '15',
        right: '4%',
        top: '15%',
        bottom: '0',
        containLabel: true
    },
    xAxis: [{
        type: 'category',
        boundaryGap: false,
        data: [],
        axisLabel: {
            show: true,
            textStyle: {
                color: '#6ba1bb',
                fontSize: 12,
            },
            axisTick: {
                show: false
            },
            format: "7DaysZ",
        },
        axisLine: {
            lineStyle: {
                color: '#0a2b52',
                width: 0.5, //这里是为了突出显示加上的
            }
        }
    }],
    yAxis: [
        {
            name: '渗流量(L/s)',
            nameTextStyle: {
                padding: [0,0,0,25],
                align: 'left',
                fontSize: 14
            },
            min: 0,
            type: 'value',
            splitNumber: 3,
            splitLine: {
                show: false
            },
            axisLabel: {
                textStyle: {
                    color: '#14A4FC'
                }
            },
            axisLine: {
                lineStyle: {
                    color: '#14A4FC'
                }
            }
        }
    ]
},

//数据方式不变,就是参数可以共用echart,只支持h5端
    findFlowHourList({
        siteCode: curSiteId || this.curSiteId,
        resCode: this.resDetail.resCode,
        beginDate: this.$utils.parseTime(date - day*24*3600000, '{y}-{m}-{d}'),
        endDate: this.$utils.parseTime(date, '{y}-{m}-{d}')
    }).then(res => {
        if(res.code === 0){
            // 判断里面是否为null
            var hasValue = false
            res.data.forEach(v=>{
                if(v.rainfall || v.rainfall === 0) {
                    hasValue = true;
                }
            })
            if(!hasValue) return;
            let times= []
            let q = []
            let maxQ = 0
            res.data.forEach(item => {
                times.push(item.time||null)
                let Q = this.getFloat2(item.flow)
                if(Q && Q>maxQ) maxQ = Q
                q.push(Q||null)
            })
            // this.sllOpts.yAxis.data[0].max = parseInt(maxQ*1.3) //ucharts
            this.sllOpts.yAxis[0].max = parseInt(maxQ*1.3)
            this.slInfo.maxQ = maxQ
            this.slInfo.now = q[q.length-1]
            this.sllOpts.xAxis[0].data = times  // echarts
            // 近7天库水位
            let opt = {
                categories: times,
                 series: [
                    {
                        index: 0,
                        name: "渗流量",
                        data: q
                    }
                ]
            };
            this.sllChartData = JSON.parse(JSON.stringify(opt));
        }
        console.log('水库渗流7天内渗流量信息', res)
    })
1
2
3
4
5
6
7
8
9
10
11
12
13
14
15
16
17
18
19
20
21
22
23
24
25
26
27
28
29
30
31
32
33
34
35
36
37
38
39
40
41
42
43
44
45
46
47
48
49
50
51
52
53
54
55
56
57
58
59
60
61
62
63
64
65
66
67
68
69
70
71
72
73
74
75
76
77
78
79
80
81
82
83
84
85
86
87
88
89
90
91
92
93
94
95
96
97
98
99
100
101
102
103
104
105
106
107
108
109
110
111
112
113
114
115
116
117
118
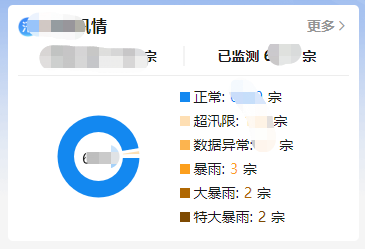
# 饼图
# 效果
# 实现
<view class="ctx-card d-flex flex-column">
    <view class="card-header flex-center">
        <view class="fw-bold flex-1">
            管理水库 {{ resWarnObj.totalCount }} 宗
        </view>
        <view class="divider"></view>
        <view class="fw-bold flex-1">
            已监测 {{ resWarnObj.monitorCount }} 宗
        </view>
    </view>
    <view class="flex-1 d-flex">
        <view class="chart-wrapper" @click="goToNext('/pagesubs/reservoir/waterRainSituation')">
            <qiun-data-charts class="chart" type="ring" :opts="optsA" :chartData="pieA" animation />
        </view>
        <view class="chart-legend flex-1 d-flex flex-column j-center" style="margin: 16rpx 0 ">
            <view v-if="item.value" v-for="(item, index) in actionList" :key="index" class="mt d-flex a-center"
                @click="goToNext('/pagesubs/reservoir/waterRainSituation', item.id)">
                <view class="point" :style="{ 'background-color': item.color }"></view>{{ item.name }}:<text
                    :style="{ 'color': item.color }" class="ml-1 mr-1">{{ item.value }}</text>宗
            </view>
        </view>
    </view>
</view>

pieA: {},
optsA: {
    color: colorList,
    dataLabel: false,
    padding: [0, 15, 0, 15],
    legend: {
        show: false,
    },
    title: { name: '' },
    subtitle: { name: '0', fontSize: '14', color: '#000' },
    extra: {
        ring: {
            ringWidth: 18
        }
    }
},
    goToNext(url, data) {
        let urlNew = url
        if (url.indexOf('preFloodInspectStatistics') > -1) {
            data = encodeURIComponent(JSON.stringify({ name: data.name, addvcd: data.addvcd }))
        }
        if (data) urlNew = `${urlNew}?data=${data}`
        uni.navigateTo({ url: urlNew })
    },
    alarmStatistics() {
        alarmStatistics({
            addvcd: this.addvcd,
        }).then(async res => {
            if (res.code === 0) {
                this.resWarnObj = res.data
                this.actionList[0].value = this.resWarnObj.normalCount;
                this.actionList[1].value = this.resWarnObj.cxxCount;
                this.actionList[2].value = this.resWarnObj.lbdCount;
                this.actionList[3].value = this.resWarnObj.mbCount;
                this.actionList[4].value = this.resWarnObj.byCount;
                this.actionList[5].value = this.resWarnObj.dbyCount;
                this.actionList[6].value = this.resWarnObj.tdbyCount;
                this.pieA = {
                    "series": [{
                        "data": this.actionList
                    }]
                }
                this.optsA.subtitle.name = String(this.resWarnObj.monitorCount)
                // console.log("---alarmStatistics---this.actionList--",JSON.stringify(this.actionList));
            }
        })
    },
1
2
3
4
5
6
7
8
9
10
11
12
13
14
15
16
17
18
19
20
21
22
23
24
25
26
27
28
29
30
31
32
33
34
35
36
37
38
39
40
41
42
43
44
45
46
47
48
49
50
51
52
53
54
55
56
57
58
59
60
61
62
63
64
65
66
67
68
69
70
71
2
3
4
5
6
7
8
9
10
11
12
13
14
15
16
17
18
19
20
21
22
23
24
25
26
27
28
29
30
31
32
33
34
35
36
37
38
39
40
41
42
43
44
45
46
47
48
49
50
51
52
53
54
55
56
57
58
59
60
61
62
63
64
65
66
67
68
69
70
71
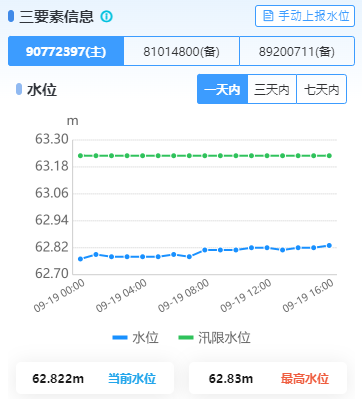
# 点图
# 效果
# 实现
<view class="water">
    <view class="title flex-center">
        <span class="desc flex-1 font-30 fw-bold color2">水位</span>
        <u-subsection class="subsection" :list="timeList" mode="subsection" @change="sectionChangeWater" :current="waterLevelTime"/>
    </view>
    <view class="chart" v-if="waterChartData.categories && waterChartData.categories.length > 0" >
        <qiun-data-charts type="line" :opts="waterOpts" :chartData="waterChartData" :ontouch="true" />
    </view>
    <view v-else class="chart mt-1 d-flex flex-column j-center a-center font-30">
        <image src="@/static/image/common/empty_chart.png" mode="widthFix" style="width:120rpx" />
        <view class="hint-text">暂无数据</view>
    </view>
    <view class="sumup">
        <view class="flex-1 p-1 d-flex a-center data-item fw-bold text-center">
            <span class="flex-1">{{ resDetail.waterLevel || '--' }}m</span>
            <span class="flex-1 color3">当前水位</span>
        </view>
        <view class="ml-3 flex-1 p-1 d-flex a-center data-item fw-bold text-center">
            <span class="flex-1">{{ waterInfo.maxZ || '--' }}m</span>
            <span class="flex-1 color4">最高水位</span>
        </view>
    </view>
</view>
<u-line/>
1
2
3
4
5
6
7
8
9
10
11
12
13
14
15
16
17
18
19
20
21
22
23
24
25
2
3
4
5
6
7
8
9
10
11
12
13
14
15
16
17
18
19
20
21
22
23
24
25
样式
    .wrapper {
      // background: linear-gradient(to bottom, #1d8ced, #66abef, #66abefAF, #f2f2f2, #f2f2f2, #f2f2f2, #f2f2f2);
      .water {
        margin-top: 16rpx;
        margin-bottom: 16rpx;

        .title {
          .desc {
            &::before {
              content: '';
              display: inline-block;
              width: 12rpx;
              height: 24rpx;
              line-height: 30rpx;
              background: #90b9f1;
              border-radius: 8rpx;
              margin-right: 10rpx;
            }
          }

          .subsection {
            width: 300rpx;
          }
        }

        .chart {
          margin-top: 16rpx;
          height: 500rpx;
        }

        .sumup{
          display: flex;
          .data-item{
            background-color: #fff; border-radius: 5px; box-shadow:0px 2px 20px 0px rgba(0,0,0,0.09);
            font-size: 23rpx;
          }
        }

      }
      .rain {

        .title {
          margin-top: 16rpx;

          .desc {
            &::before {
              content: '';
              display: inline-block;
              width: 12rpx;
              height: 24rpx;
              line-height: 30rpx;
              background: #90b9f1;
              border-radius: 8rpx;
              margin-right: 10rpx;
            }
          }

          .subsection {
            width: 300rpx;
          }
        }

        .chart {
          margin-top: 16rpx;
          height: 500rpx;
        }

        .sumup{
          display: flex;
          .data-item{
            background-color: #fff; border-radius: 5px; box-shadow:0px 2px 20px 0px rgba(0,0,0,0.09);
            font-size: 23rpx;
          }
        }
      }
    }
  }
1
2
3
4
5
6
7
8
9
10
11
12
13
14
15
16
17
18
19
20
21
22
23
24
25
26
27
28
29
30
31
32
33
34
35
36
37
38
39
40
41
42
43
44
45
46
47
48
49
50
51
52
53
54
55
56
57
58
59
60
61
62
63
64
65
66
67
68
69
70
71
72
73
74
75
76
77
2
3
4
5
6
7
8
9
10
11
12
13
14
15
16
17
18
19
20
21
22
23
24
25
26
27
28
29
30
31
32
33
34
35
36
37
38
39
40
41
42
43
44
45
46
47
48
49
50
51
52
53
54
55
56
57
58
59
60
61
62
63
64
65
66
67
68
69
70
71
72
73
74
75
76
77
逻辑
timeList: [{
				name: '一天内',
				value: 1,
			},
			{
				name: '三天内',
				value: 3,
			},
			{
				name: '七天内',
				value: 7,
			}],
			rainTimeList: [{
				name: '一天内',
				value: 1,
			},
			{
				name: '三天内',
				value: 3,
			},
			{
				name: '七天内',
				value: 7,
			}],
			waterInfo: { // 库水位信息
				maxZ: 0,
				now: 0
			},
			waterChartData: {},
			waterOpts: {
				timing: "easeOut",
				duration: 1000,
				color: ["#14A4FC", "#fc662a", "#D3D3D3"],
				padding: [15, 10, 0, 15],
				fontSize: 13,
				fontColor: "#666666",
				dataLabel: false, //是否显示线上得值
				dataPointShape: true,
				dataPointShapeType: "solid",
				touchMoveLimit: 60,
				enableScroll: false,
				legend: {
					show: true,
					position: "bottom",
					float: "center",
					padding: 10,
					margin: 8,
					backgroundColor: "rgba(0,0,0,0)",
					borderColor: "rgba(0,0,0,0)",
					borderWidth: 0,
					fontSize: 13,
					fontColor: "#666666",
					lineHeight: 11,
					hiddenColor: "#CECECE",
					itemGap: 20
				},
				xAxis: {
					marginTop:5,
					labelCount: 6,
					fontSize: 10,
					rotateLabel: true,
					rotateAngle: 30,
				},
				yAxis: {
					gridType: "dash",
					dashLength: 2,
					disabled: false,
					disableGrid: false,
					splitNumber: 5,
					gridColor: "#CCCCCC",
					padding: 10,
					showTitle: true,
					data: [
						{
							tofix: 0, // Y轴刻度值保留的小数位数
							title: 'm', //单位
							titleOffsetY: -5
						}
					]
				},
				extra: {
					line: {
						type: "straight",
						width: 2,
						activeType: "hollow",
						linearType: "none",
						onShadow: false,
						animation: "vertical"
					},
					tooltip: {
						showBox: true,
						showArrow: true,
						showCategory: false,
						borderWidth: 0,
						borderRadius: 0,
						borderColor: "#000000",
						borderOpacity: 0.7,
						bgColor: "#000000",
						bgOpacity: 0.7,
						gridType: "solid",
						dashLength: 4,
						gridColor: "#CCCCCC",
						boxPadding: 3,
						fontSize: 13,
						lineHeight: 20,
						fontColor: "#FFFFFF",
						legendShow: true,
						legendShape: "auto",
						splitLine: true,
						horizentalLine: false,
						xAxisLabel: false,
						yAxisLabel: false,
						labelBgColor: "#FFFFFF",
						labelBgOpacity: 0.7,
						labelFontColor: "#666666"
					},
					markLine: {
						type: "solid",
						dashLength: 4,
						data: []
					}
				}
			},
			rainInfo: { // 雨量信息
				maxQ: 0,
				now: 0,
				yesterday: 0
			},
			rainLoading: false,
			// 近一月雨量
			rainChartData: { categories: [] },
			rainOpts: {
				color: ["#1890FF","#91CB74","#FAC858","#EE6666","#73C0DE","#3CA272","#FC8452","#9A60B4","#ea7ccc"],
				padding: [15,5,0,5],
				legend: {
					// show: false
					show: true,
					position: "bottom",
					float: "center",
					padding: 10,
					margin: 8,
					backgroundColor: "rgba(0,0,0,0)",
					borderColor: "rgba(0,0,0,0)",
					borderWidth: 0,
					fontSize: 13,
					fontColor: "#666666",
					lineHeight: 11,
					hiddenColor: "#CECECE",
					itemGap: 20
				},
				dataLabel: false,
				dataPointShape: false,
				enableScroll: false,
				grid: {
					left: '15',
					right: '15',
					top: '15%',
					bottom: '0%',
					containLabel: true
				},
				xAxis: {
					marginTop:5,
					disableGrid: true,
					labelCount: 6,
					fontSize: 10,
					rotateLabel: true,
					rotateAngle: 30,
				},
				yAxis: {
					disabled: false,
					disableGrid: false,
					splitNumber: 5,
					gridType: "dash",
					dashLength: 2,
					gridColor: "#CCCCCC",
					padding: 10,
					showTitle: true,
					data: [
					{
						position: "left",
						title: "m",
						textAlign: "left",
						titleOffsetY: -5
					},
					{
						position: "right",
						title: "mm",
					},]
				},
				extra: {
					line: {
						type: "curve",
						width: 2,
						activeType: "hollow",
						linearType: "custom"
					},
					column: {
						type: "group",
						width: 20,
						activeBgColor: "#000000",
						activeBgOpacity: 0.08,
						linearType: "custom",
						seriesGap: 5,
						linearOpacity: 0.5,
						barBorderCircle: true,
						categoryGap: 2,
						customColor: [
							"#FA7D8D"
						]
					}
				},
			},
		}
		findRsvrHourList(curSiteId) {
			if (!(curSiteId || this.curSiteId)) return;
			let date = new Date().getTime()
			this.kswChartData = {}
			let day;
			if (this.waterLevelTime == 0) {
				day = 0
			} else if (this.waterLevelTime == 1) {
				day = 2
			} else {
				day = 6
			}
			// 默认一天
			findRsvrHourList({
				siteCode: curSiteId || this.curSiteId,
				resCode: this.resDetail.resCode,
				beginDate: this.$utils.parseTime(date - day * 24 * 3600000, '{y}-{m}-{d}'),
				endDate: this.$utils.parseTime(date, '{y}-{m}-{d}')
			}).then(res => {
				if (res.code === 0) {
					// 判断里面是否为null
					var hasValue = false
					res.data.forEach(v => {
						if (v.waterlevel || v.waterlevel === 0) {
							hasValue = true;
						}
					})
					if (!hasValue) {
						this.waterChartData = {
							categories:[],
						}
						this.waterInfo.maxZ = 0
						return;
					}
					let times = []
					let z = []
					let x = []   // z:水位, w:库容, x:汛限水位
					let maxZ = 0
					res.data.forEach((item, index) => {
						if (item.time) {
							times.push(item.time.substr(5, item.time.length - 1) || null)
						} else {
							times.push(null)
						}
						let Z = this.getFloat2(item.waterlevel)
						if (Z && Z > maxZ) maxZ = Z
						z.push(Z || null)
						x.push(this.resDetail.fsltdz || null)
					})
					// times = times.reverse()
					this.waterInfo.maxZ = maxZ
					let opt = {
						categories: times,
						series: [
							{
								name: "水位",
								color: "#1890ff",
								data: z,
								textSize: 10
							},
							{
								name: "汛限水位",
								color: "#2fc25b",
								data: x,
								textSize: 10
							},
						]
					};
					this.waterChartData = JSON.parse(JSON.stringify(opt));
				}
			})
		},
1
2
3
4
5
6
7
8
9
10
11
12
13
14
15
16
17
18
19
20
21
22
23
24
25
26
27
28
29
30
31
32
33
34
35
36
37
38
39
40
41
42
43
44
45
46
47
48
49
50
51
52
53
54
55
56
57
58
59
60
61
62
63
64
65
66
67
68
69
70
71
72
73
74
75
76
77
78
79
80
81
82
83
84
85
86
87
88
89
90
91
92
93
94
95
96
97
98
99
100
101
102
103
104
105
106
107
108
109
110
111
112
113
114
115
116
117
118
119
120
121
122
123
124
125
126
127
128
129
130
131
132
133
134
135
136
137
138
139
140
141
142
143
144
145
146
147
148
149
150
151
152
153
154
155
156
157
158
159
160
161
162
163
164
165
166
167
168
169
170
171
172
173
174
175
176
177
178
179
180
181
182
183
184
185
186
187
188
189
190
191
192
193
194
195
196
197
198
199
200
201
202
203
204
205
206
207
208
209
210
211
212
213
214
215
216
217
218
219
220
221
222
223
224
225
226
227
228
229
230
231
232
233
234
235
236
237
238
239
240
241
242
243
244
245
246
247
248
249
250
251
252
253
254
255
256
257
258
259
260
261
262
263
264
265
266
267
268
269
270
271
272
273
274
275
276
277
278
279
280
281
282
283
284
285
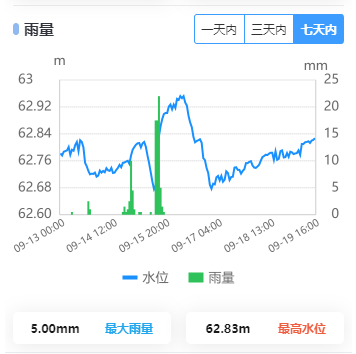
# 柱子图
# 效果
# 实现
	<view class="rain">
    <view class="title flex-center">
        <span class="desc flex-1 font-30 fw-bold color2">雨量</span>
        <u-subsection class="subsection" :list="rainTimeList" mode="subsection" @change="sectionChangeRain" :current="rainWaterTime"/>
    </view>
    <!-- <view class="flex-center j-end mt-2">
        <span class="fw-bold fs-3">{{ rainInfo.maxQ }}mm</span>
        <span class="fw-bold fs-3 color3 ml-1 mr-2">最大雨量</span>
    </view> -->
    <view class="pb-2">
        <view v-if="rainChartData.categories.length && !rainLoading" class="chart">
            <!-- type="column" -->
            <qiun-data-charts type="mix" :opts="rainOpts" :chartData="rainChartData" canvasId="ylCanvas2d" :canvas2d="true" :ontouch="true" :onmovetip="true" tooltipFormat="tooltipTempTime" />
        </view>
        <view v-else-if="!rainLoading" class="chart mt-1 d-flex flex-column j-center a-center font-30">
            <image src="@/static/image/common/empty_chart.png" mode="widthFix" style="width:120rpx" />
            <view class="hint-text"> 暂无数据 </view>
        </view>
        <u-loading-icon v-if="rainLoading" class="chart" mode="circle" color="#23A6EB"></u-loading-icon>
    </view>
    <view class="sumup">
        <view class="flex-1 p-1 d-flex a-center data-item fw-bold text-center">
            <span class="flex-1">{{ rainInfo.maxQ || '--' }}mm</span>
            <span class="flex-1 color3">最大雨量</span>
        </view>
        <view class="ml-3 flex-1 p-1 d-flex a-center data-item fw-bold text-center">
            <span class="flex-1">{{ waterInfo.maxZ || '--' }}m</span>
            <span class="flex-1 color4">最高水位</span>
        </view>
    </view>
</view>
1
2
3
4
5
6
7
8
9
10
11
12
13
14
15
16
17
18
19
20
21
22
23
24
25
26
27
28
29
30
31
2
3
4
5
6
7
8
9
10
11
12
13
14
15
16
17
18
19
20
21
22
23
24
25
26
27
28
29
30
31
逻辑
		findRsvrPptnHourList(curSiteId) {
			if (!(curSiteId || this.curSiteId)) return;
			this.rainLoading = true;
			let date = new Date().getTime()
			let day;
			// 对应一天,三天,七天
			if (this.rainWaterTime == 0) {
				day = 0
			} else if (this.rainWaterTime == 1) {
				day = 2
			} else {
				day = 6
			}
			findRsvrPptnHourList({
				siteCode: curSiteId || this.curSiteId,
				resCode: this.resDetail.resCode,
				beginDate: this.$utils.parseTime(date - day * 24 * 3600000, '{y}-{m}-{d}'),
				endDate: this.$utils.parseTime(date, '{y}-{m}-{d}')
			}).then(res => {
				if (res.code === 0) {
					this.rainLoading = false;
					// // 判断里面是否为null
					// var hasValue = false
					// res.data.forEach(v => {
					// 	if (v.rainfall || v.rainfall === 0) {
					// 		hasValue = true;
					// 	}
					// })
					// if (!hasValue) {
					// 	this.rainChartData.categories = []
					// 	return
					// };
					let xData = []
					const waterData = []
					const rainData = []
					let maxQ = 0
					let dypData = res.data || []
					dypData.forEach(item => {
						// xData.push((item.time && item.time.substr(5, item.time.length - 1)) || null)
						xData.push(item.time.slice(5))
						waterData.push(item.waterlevel)
						// rainData.push(item.rainfall)
						let DYP = this.getFloat2(item.rainfall)
						if (DYP && DYP > maxQ) maxQ = DYP
						rainData.push(DYP || null)
					})
					this.rainInfo.maxQ = maxQ
					this.rainInfo.now = maxQ
					let chart = {
						categories: xData,
						series: [
						{
							name: "水位",
							type: "line",
							color: "#1890ff",
							data: waterData
						},
						{
							index: 1,
							name: "雨量",
							type: "column",
							color: "#2fc25b",
							data: rainData
						},]
					}
					this.rainChartData = JSON.parse(JSON.stringify(chart));
				}
				console.log('近一个月内降雨量', res)
			})
		},
1
2
3
4
5
6
7
8
9
10
11
12
13
14
15
16
17
18
19
20
21
22
23
24
25
26
27
28
29
30
31
32
33
34
35
36
37
38
39
40
41
42
43
44
45
46
47
48
49
50
51
52
53
54
55
56
57
58
59
60
61
62
63
64
65
66
67
68
69
70
2
3
4
5
6
7
8
9
10
11
12
13
14
15
16
17
18
19
20
21
22
23
24
25
26
27
28
29
30
31
32
33
34
35
36
37
38
39
40
41
42
43
44
45
46
47
48
49
50
51
52
53
54
55
56
57
58
59
60
61
62
63
64
65
66
67
68
69
70
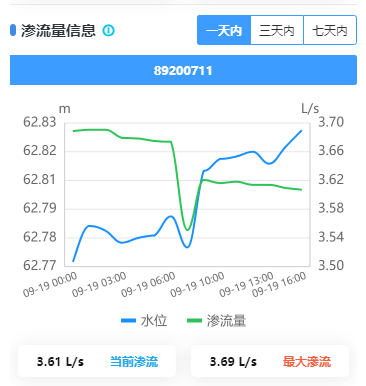
# 混合图
# 效果
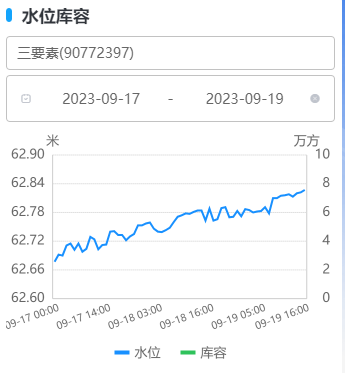
# 实现
<view class="wrapper">
    <view class="water">
        <!-- <view class="title flex-center">
            <span class="desc flex-1 font-30 fw-bold color2">渗流量</span>
            <u-subsection class="subsection" :list="timeList" mode="subsection" @change="sectionChangeWater" :current="waterLevelTime"/>
        </view> -->
        <view class="chart" v-if="waterChartData.categories && waterChartData.categories.length > 0" >
            <qiun-data-charts type="line" :opts="waterOpts" :chartData="waterChartData" :ontouch="true" />
        </view>
        <view v-else class="chart mt-1 d-flex flex-column j-center a-center font-30">
            <image src="@/static/image/common/empty_chart.png" mode="widthFix" style="width:120rpx" />
            <view class="hint-text">暂无数据</view>
        </view>
        <view class="sumup">
            <view class="flex-1 p-1 d-flex a-center data-item fw-bold text-center">
                <span class="flex-1">{{ waterInfo.now || '--' }} L/s</span>
                <span class="flex-1 color3">当前渗流</span>
            </view>
            <view class="ml-3 flex-1 p-1 d-flex a-center data-item fw-bold text-center">
                <span class="flex-1">{{ waterInfo.max || '--' }} L/s</span>
                <span class="flex-1 color4">最大滲流</span>
            </view>
        </view>
    </view>
</view>
  .info {
    margin: 20rpx 16rpx;

    .wrapper {
      .water {
        margin-top: 20rpx;
        margin-bottom: 20rpx;

        .title {
          .desc {
            &::before {
              content: '';
              display: inline-block;
              width: 12rpx;
              height: 24rpx;
              line-height: 30rpx;
              background: #408ae8;
              border-radius: 8rpx;
              margin-right: 10rpx;
            }
          }

          .subsection {
            width: 300rpx;
          }
        }

        .chart {
          margin-top: 20rpx;
          height: 500rpx;
        }

        .sumup{
          display: flex;
          .data-item{
            background-color: #fff; border-radius: 5px; box-shadow:0px 2px 20px 0px rgba(0,0,0,0.09);
            font-size: 23rpx;
          }
        }

      }
    }
  }
}
1
2
3
4
5
6
7
8
9
10
11
12
13
14
15
16
17
18
19
20
21
22
23
24
25
26
27
28
29
30
31
32
33
34
35
36
37
38
39
40
41
42
43
44
45
46
47
48
49
50
51
52
53
54
55
56
57
58
59
60
61
62
63
64
65
66
67
68
69
2
3
4
5
6
7
8
9
10
11
12
13
14
15
16
17
18
19
20
21
22
23
24
25
26
27
28
29
30
31
32
33
34
35
36
37
38
39
40
41
42
43
44
45
46
47
48
49
50
51
52
53
54
55
56
57
58
59
60
61
62
63
64
65
66
67
68
69
逻辑
特殊配置
<!-- type="column"  mix -->
<qiun-data-charts type="column" :opts="rainOpts" :chartData="rainChartData" canvasId="ylCanvas2d" :canvas2d="true" :ontouch="true" :onmovetip="true" tooltipFormat="tooltipTempTime" />

extra: {
    line: {
        type: "curve",
        width: 2,
        activeType: "hollow",
        linearType: "custom"
    },
    column: {
        // type: "group",
        // width: 20,
        // activeBgColor: "#000000",
        // activeBgOpacity: 0.08,
        // linearType: "custom",
        // seriesGap: 5,
        // linearOpacity: 0.5,
        // barBorderCircle: true,
        // categoryGap: 2,
        // customColor: [
        // 	"#FA7D8D"
        // ]
        type: "group",
        width: 20,
        activeBgColor: "#000000",
        activeBgOpacity: 0.08
    },
    mix: {
        column: {
            // type: "group",
            width: 20,
            activeBgColor: "#000000",
            activeBgOpacity: 0.08
        }
    }
},
1
2
3
4
5
6
7
8
9
10
11
12
13
14
15
16
17
18
19
20
21
22
23
24
25
26
27
28
29
30
31
32
33
34
35
36
37
2
3
4
5
6
7
8
9
10
11
12
13
14
15
16
17
18
19
20
21
22
23
24
25
26
27
28
29
30
31
32
33
34
35
36
37
完整配置
timeList: [{
    name: '一天内',
    value: 1,
},
{
    name: '三天内',
    value: 3,
},
{
    name: '七天内',
    value: 7,
}],
rainTimeList: [{
    name: '一天内',
    value: 1,
},
{
    name: '三天内',
    value: 3,
},
{
    name: '七天内',
    value: 7,
}],
waterInfo: {
    now: 0,
    max: 0,
},
waterChartData: {},
waterOpts: {
    color: ["#1890FF","#91CB74","#FAC858","#EE6666","#73C0DE","#3CA272","#FC8452","#9A60B4","#ea7ccc"],
    padding: [15,5,0,5],
    legend: {
        show: true,
        position: "bottom",
        float: "center",
        padding: 10,
        margin: 8,
        backgroundColor: "rgba(0,0,0,0)",
        borderColor: "rgba(0,0,0,0)",
        borderWidth: 0,
        fontSize: 13,
        fontColor: "#666666",
        lineHeight: 11,
        hiddenColor: "#CECECE",
        itemGap: 20
    },
    dataLabel: false,
    dataPointShape: false,
    enableScroll: false,
    xAxis: {
        // itemCount: 5,
        disableGrid: true,
        labelCount:6,
        rotateLabel: true,
        rotateAngle: 20,
        fontSize: 10,
        marginTop:5,
    },
    yAxis: {
        disabled: false,
        disableGrid: false,
        splitNumber: 5,
        gridType: "dash",
        dashLength: 2,
        gridColor: "#CCCCCC",
        padding: 10,
        showTitle: true,
        data: [{
            position: "left",
            title: "m",
            textAlign: "left"
        },
        {
            position: "right",
            title: "L/s",
        },]
    },
    extra: {
        line: {
            type: "curve",
            width: 2,
            activeType: "hollow",
            linearType: "custom"
        }
    }
},
getData() {
    findSiteList({ resCode: this.$Route.query.data, codeType: 5 }).then(res => {
        if (res.code === 0) {
            if (res.data && res.data.length > 0) {
                this.threeList = res.data.splice(0,3)
            }
            this.threeList = this.threeList.map((item) => {
                return {
                    value: item.siteCode,
                    name: item.siteCode
                }
            });
            if (this.threeList.length > 0) {
                this.curSiteId = this.threeList[0].value
                this.findRsvrPrnmsrList()
            }
        }
    })
},
findRsvrPrnmsrList(curSiteId) {
    if (!(curSiteId || this.curSiteId)) return;
    let date = new Date().getTime()
    this.kswChartData = {}
    let day;
    if (this.waterLevelTime == 0) {
        day = 0
    } else if (this.waterLevelTime == 1) {
        day = 2
    } else {
        day = 6
    }
    findRsvrPrnmsrList({
        siteCode: curSiteId || this.curSiteId,
        resCode: this.resDetail.resCode,
        beginDate: this.$utils.parseTime(date - day * 24 * 3600000, '{y}-{m}-{d}'),
        endDate: this.$utils.parseTime(date, '{y}-{m}-{d}')
    }).then(res => {
        if (res.code === 0) {
            const xData = []
            const waterData = []
            const flowData = []
            let q = []
            let max = 0
            if (res.data && res.data.length > 0) {
                res.data.forEach((item) => {
                    xData.push(item.time.slice(5))
                    flowData.push(item.flow)
                    waterData.push(item.waterLevel)
                    let Q = this.getFloat2(item.flow)
                    if (Q && Q > max) max = Q
                    q.push(Q || null)
                })
                this.waterInfo.now = q[q.length - 1]
                this.waterInfo.max = max
            }
            const that = this
            that.$nextTick(() => {
                let chart = {
                categories: xData,
                series: [
                {
                    name: "水位",
                    type: "line",
                    color: "#1890ff",
                    data: waterData
                },{
                    index: 1,
                    name: "渗流量",
                    type: "line",
                    color: "#2fc25b",
                    data: flowData
                },]
            }
            this.waterChartData = JSON.parse(JSON.stringify(chart))
           })
        }
    })
},
1
2
3
4
5
6
7
8
9
10
11
12
13
14
15
16
17
18
19
20
21
22
23
24
25
26
27
28
29
30
31
32
33
34
35
36
37
38
39
40
41
42
43
44
45
46
47
48
49
50
51
52
53
54
55
56
57
58
59
60
61
62
63
64
65
66
67
68
69
70
71
72
73
74
75
76
77
78
79
80
81
82
83
84
85
86
87
88
89
90
91
92
93
94
95
96
97
98
99
100
101
102
103
104
105
106
107
108
109
110
111
112
113
114
115
116
117
118
119
120
121
122
123
124
125
126
127
128
129
130
131
132
133
134
135
136
137
138
139
140
141
142
143
144
145
146
147
148
149
150
151
152
153
154
155
156
157
158
159
160
161
162
163
164
165
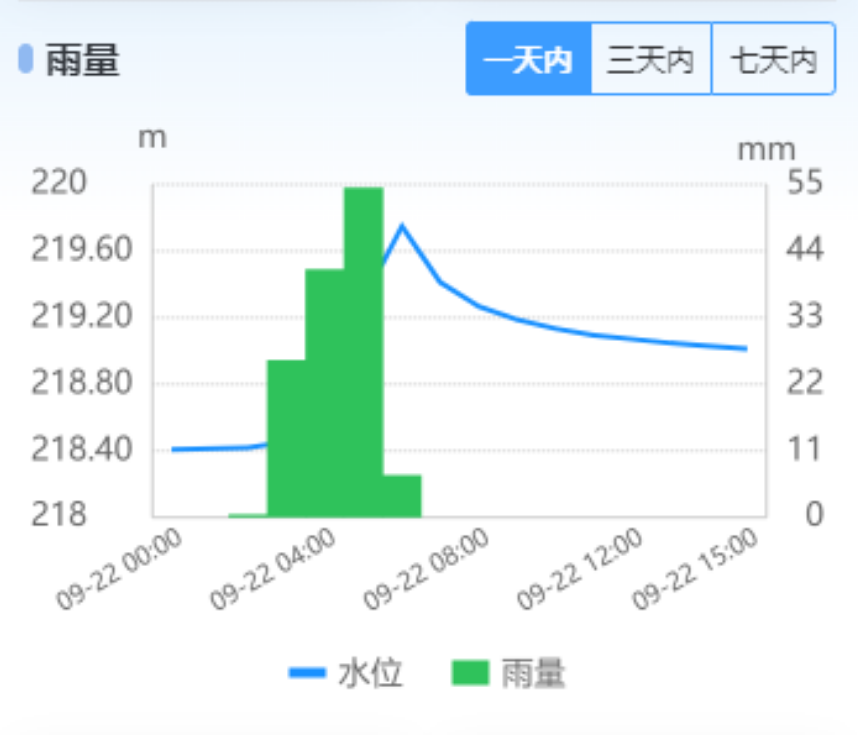
# 目前碰到的问题
图表数据混合错位,没有好方式同时显示;
# 曲线图
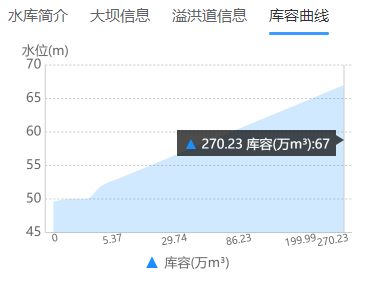
# 效果
# 实现
<template>
  <view class="TabStorageCapacityCurve">
    <view class="charts-box">
      <qiun-data-charts type="mix" :opts="opts" :ontouch="true" :chartData="chartData" />
    </view>
  </view>
</template>

<script >
import { relResWlstcparrlList } from "@/api/reservoir";

export default {
  name: "TabStorageCapacityCurve",
  props: {},
  data() {
    return {
      chartData: {},
      opts: {
        color: ["#1890FF", "#91CB74", "#FAC858", "#EE6666", "#73C0DE", "#3CA272", "#FC8452", "#9A60B4", "#ea7ccc"],
        padding: [15, 40, 0, 10],
        enableScroll: false,
        touchMoveLimit: 60,
        dataLabel: false, //是否显示线上得值
        legend: {
          show: true,
          position: "bottom",
          float: "center",
          padding: 10,
          margin: 8,
          backgroundColor: "rgba(0,0,0,0)",
          borderColor: "rgba(0,0,0,0)",
          borderWidth: 0,
          fontSize: 13,
          fontColor: "#666666",
          lineHeight: 11,
          hiddenColor: "#CECECE",
          itemGap: 20
        },
        xAxis: {
          // itemCount: 6,
          labelCount:6,
          rotateLabel: true,
          rotateAngle: 10,
          disableGrid: true,
          fontSize: 10,
          // title: "库容(万m³)",
        },
        yAxis: {
          disabled: false,
          disableGrid: false,
          splitNumber: 5,
          gridType: "dash",
          // dashLength: 4,
          gridColor: "#CCCCCC",
          padding: 10,
          showTitle: true,
          data: [
            {
              position: "left",
              title: "水位(m)",
            }
          ]
        },
        extra: {
          area: {
            type: "curve",
            opacity: 0.2,
            addLine: true,
            width: 2,
            gradient: true,
            activeType: "hollow"
          },
          line: {
            type: "curve",
            width: 1,
            activeType: "hollow"
          },
        }
      },
    }
  },
  computed: {},
  watch: {},
  mounted() {
    this.getData()
  },
  methods: {
    getData() {
      relResWlstcparrlList({
        resCode: this.$Route.query.data
      }).then((res) => {
        if (res.code === 0) {
          const xData = []
          const stcpData = []
          if (res.data && res.data.length > 0) {
            res.data = this.sortArr(res.data, 'wl')//其实现在接口默认排序了
            res.data.forEach((el) => {
              xData.push(el.wl)
              stcpData.push(el.stcp)
            })
          }
          const that = this
          that.$nextTick(() => {
            let chart = {
              categories: stcpData,
              series: [
                {
                  name: "库容(万m³)",
                  type: "area",
                  style: "curve",
                  data: xData
                },
              //   {
              //   name: "曲线",
              //   type: "line",
              //   style: "curve",
              //   color: "#1890ff",
              //   disableLegend: true,
              //   data: xData
              //  },
              ]
            }
            this.chartData = JSON.parse(JSON.stringify(chart))
          })
        }
      })
    },
        // 按照数组某个属性值排序
    sortArr(arr, attr = 'id', flag = true) {
      var temp = null
      for (var i = 0; i < arr.length - 1; i++) { // 比较arr.length-1轮
        for (var j = i + 1; j < arr.length; j++) {
          if (arr[i][attr] > arr[j][attr] && flag == true) { // 交换
            temp = arr[i][attr] // 临时变量
            arr[i][attr] = arr[j][attr]
            arr[j][attr] = temp
          } else if (arr[i][attr] < arr[j][attr] && flag == false) {
            temp = arr[i][attr] // 临时变量
            arr[i][attr] = arr[j][attr]
            arr[j][attr] = temp
          }
        }
      }
      return arr
    },
  },
}
</script>

<style  lang="scss" scoped>
.TabStorageCapacityCurve {
  padding-left: 10rpx;

  .charts-box {
    width: 100%;
    height: 500rpx;
  }
}
</style>
1
2
3
4
5
6
7
8
9
10
11
12
13
14
15
16
17
18
19
20
21
22
23
24
25
26
27
28
29
30
31
32
33
34
35
36
37
38
39
40
41
42
43
44
45
46
47
48
49
50
51
52
53
54
55
56
57
58
59
60
61
62
63
64
65
66
67
68
69
70
71
72
73
74
75
76
77
78
79
80
81
82
83
84
85
86
87
88
89
90
91
92
93
94
95
96
97
98
99
100
101
102
103
104
105
106
107
108
109
110
111
112
113
114
115
116
117
118
119
120
121
122
123
124
125
126
127
128
129
130
131
132
133
134
135
136
137
138
139
140
141
142
143
144
145
146
147
148
149
150
151
152
153
154
155
156
157
158
159
# 地图
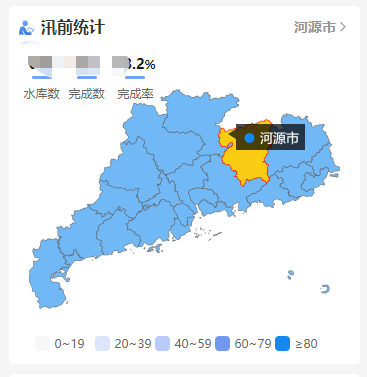
# 这种图表点击提示,支持app端操作;
# 效果
# 实现
<view class="content">
    <view class="charts-box">
        <view class="data-show uni-flex-start">
            <view v-for="(item, index) in mapDataShow" :key="index" class="item uni-flex-start uni-flex-wrap">
                <view class="num">
                    {{ item.num }}
                    <text v-if="item.name === '完成率'" class="percent">%</text>
                </view>
                <view class="line uni-flex-center">
                    <view />
                </view>
                <view class="text">{{ item.name }}</view>
            </view>
        </view>
        <view class="chart">
            <qiun-data-charts type="map" canvasId="mapGdProvince" :opts="gdMapOpts" :chart-data="resPatrolChartData" :canvas2d="true" @getIndex="getIndex"/>
        </view>
        <view class="legent uni-flex-center">
            <view class="chart-legent uni-flex-center uni-flex-wrap">
                <view v-for="(item, index) in mapLegent" :key="index" class="mapLegent-item uni-flex-start">
                    <view class="mapLegent-color" :style="{ backgroundColor: item.color }" />
                    <view class="mapLegent-text">{{ item.text }}</view>
                </view>
            </view>
        </view>
    </view>
</view>
1
2
3
4
5
6
7
8
9
10
11
12
13
14
15
16
17
18
19
20
21
22
23
24
25
26
27
2
3
4
5
6
7
8
9
10
11
12
13
14
15
16
17
18
19
20
21
22
23
24
25
26
27
编码
import mapdata from '@/common/gdProvince.json'
import uCharts from "@/uni_modules/qiun-data-charts/js_sdk/u-charts/config-ucharts.js";

mapSelectArea: {
    name: '广东省',
    addvcd: '440000',
    totalCount: 0,
    polCount: 0,
    polPercent: 0,
},
mapDataShow: [
    {
        name: '水库数',
        num: 0
    },
    {
        name: '完成数',
        num: 0
    },
    {
        name: '完成率',
        num: 0
    }
],
mapLegent: [
    {
        value: 0,
        text: '0~19',
        color: '#f7f7f7'
    },
    {
        value: 20,
        text: '20~39',
        color: '#dce5fc'
    },
    {
        value: 40,
        text: '40~59',
        color: '#b9cbf8'
    },
    {
        value: 60,
        text: '60~79',
        color: '#7398f2'
    },
    {
        value: 80,
        text: '≥80',
        color: '#1388f0'
    }
],
resPatrolChartData: {},
floodStateList: [],
addvcd: '440000',
}

findBeforeFloodState() {
    findBeforeFloodState({
        addvcd: this.addvcd,
    }).then(async res => {
        if (res.code === 0) {
            this.floodStateList = Object.freeze(res.data)
            this.updateTipsInfo(null, true)
            // let mapseries = mapdata.features
            let mapseries = mapdata.features.map((item) => {
                let dataItem = this.floodStateList.find((x) => x.addvcd == item.properties.adcode) || {
                    addvcd: item.properties.adcode,
                    polCount: 0,
                    polPercent: 0,
                    totalCount: 0,
                    color: '#fff'
                }
                const color = this.addColor(dataItem?.polPercent)
                item.color = color
                item.data = {
                    ...dataItem,
                    color,
                }
                return item
            })
            this.resPatrolChartData = JSON.parse(JSON.stringify({
                series: mapseries
            }))
        }
    })
},
getIndex(e) {
    let series = uCharts.option[e.id].series
    let index = e.currentIndex
    const data = series[index]?.data
    this.updateTipsInfo(data, false)
},
updateTipsInfo(dataNew, isAll) {
    let data = dataNew
    if (isAll && this.floodStateList && this.floodStateList.length > 0) {
        let totalCountAll = 0;
        let polCountAll = 0;
        this.floodStateList.forEach(item => {
            totalCountAll += item.totalCount
            polCountAll += item.polCount
        })
        data = {
            name: '广东省',
            addvcd: '440000',
            totalCount: totalCountAll,
            polCount: polCountAll,
            polPercent: this.$options.filters.getFloat2(polCountAll / totalCountAll * 100)
        }
    }
    this.mapSelectArea = {
        ...this.mapSelectArea,
        ...data,
    }
    this.mapDataShow[0].num = this.mapSelectArea.totalCount;
    this.mapDataShow[1].num = this.mapSelectArea.polCount;
    this.mapDataShow[2].num = this.mapSelectArea.polPercent;
},
addColor(count) {
    if (count >= this.mapLegent[4].value) {
        return this.mapLegent[4].color
    } else if (count >= this.mapLegent[3].value) {
        return this.mapLegent[3].color
    } else if (count >= this.mapLegent[2].value) {
        return this.mapLegent[2].color
    } else if (count >= this.mapLegent[1].value) {
        return this.mapLegent[1].color
    } else {
        return this.mapLegent[0].color
    }
},
1
2
3
4
5
6
7
8
9
10
11
12
13
14
15
16
17
18
19
20
21
22
23
24
25
26
27
28
29
30
31
32
33
34
35
36
37
38
39
40
41
42
43
44
45
46
47
48
49
50
51
52
53
54
55
56
57
58
59
60
61
62
63
64
65
66
67
68
69
70
71
72
73
74
75
76
77
78
79
80
81
82
83
84
85
86
87
88
89
90
91
92
93
94
95
96
97
98
99
100
101
102
103
104
105
106
107
108
109
110
111
112
113
114
115
116
117
118
119
120
121
122
123
124
125
126
127
128
129
130
上次更新: 2023/11/17, 05:08:20
